fourier#
Fourier seasonality transformations.
This modules provides Fourier seasonality transformations for use in Marketing Mix Models. The Fourier seasonality is a set of sine and cosine functions that can be used to model periodic patterns in the data.
There are three types of Fourier seasonality transformations available:
Yearly Fourier: A yearly seasonality with a period of 365.25 days
Monthly Fourier: A monthly seasonality with a period of 365.25 / 12 days
Weekly Fourier: A weekly seasonality with a period of 7 days
(Source code, png, hires.png, pdf)

Examples#
Use yearly fourier seasonality for custom Marketing Mix Model.
import pandas as pd
import pymc as pm

from pymc_marketing.mmm import YearlyFourier

yearly = YearlyFourier(n_order=3)

dates = pd.date_range("2023-01-01", periods=52, freq="W-MON")

dayofyear = dates.dayofyear.to_numpy()

with pm.Model() as model:
    fourier_trend = yearly.apply(dayofyear)
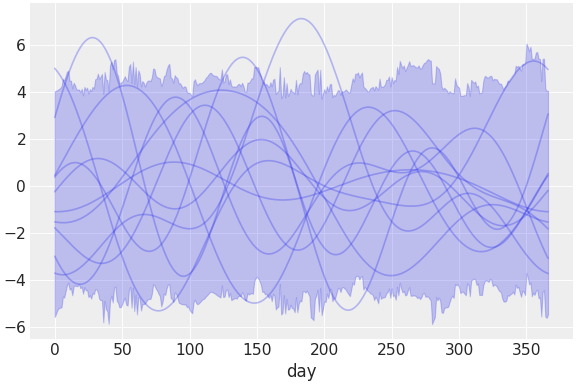
Plot the prior fourier seasonality trend.
(Source code, png, hires.png, pdf)

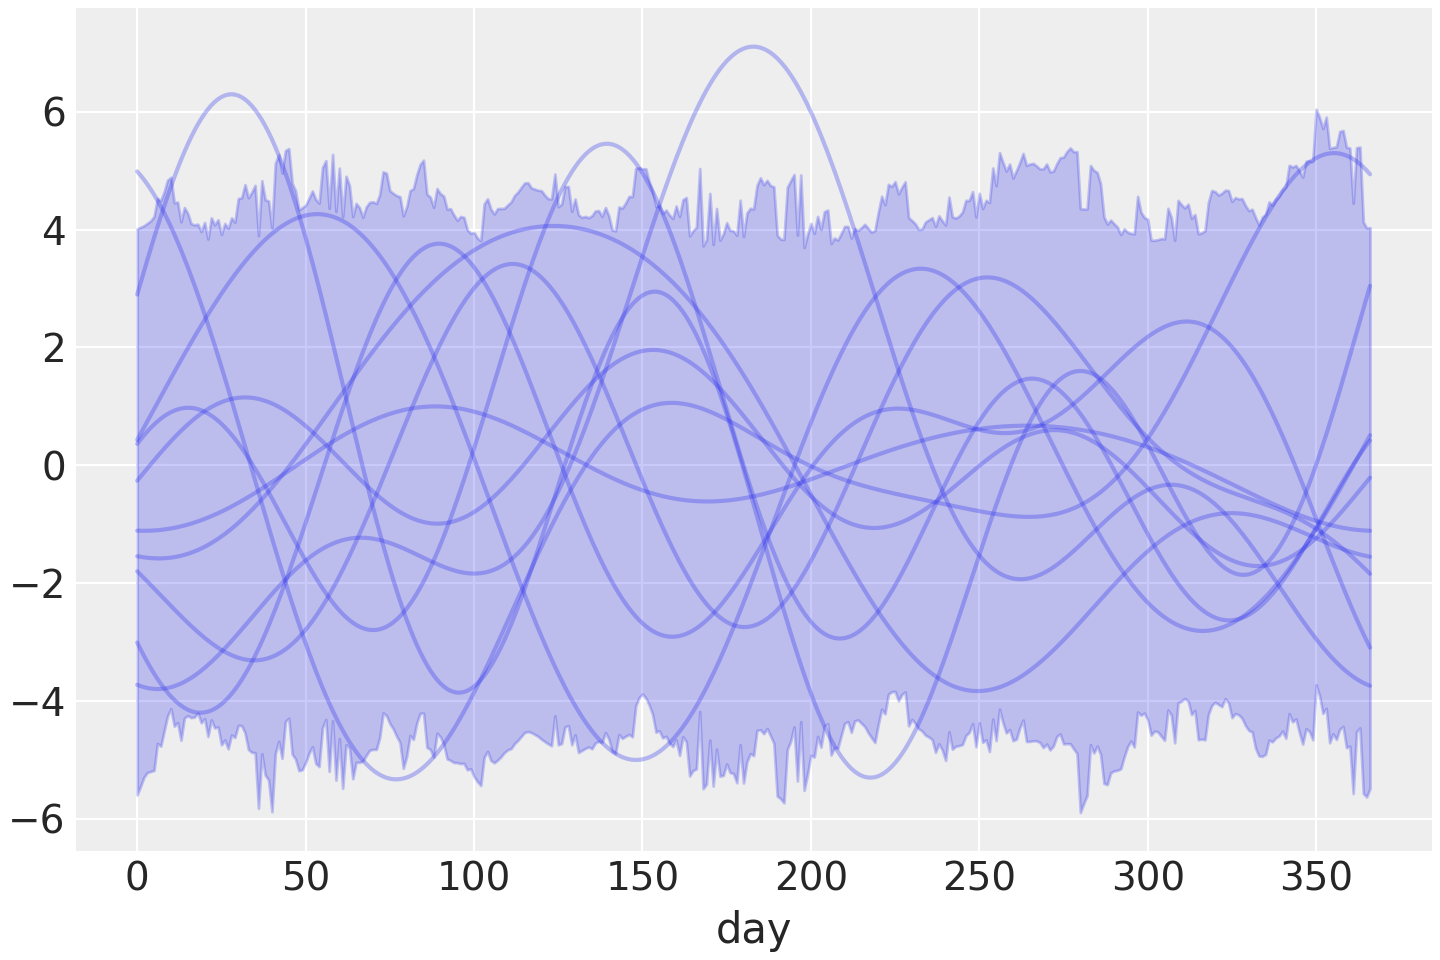
Change the prior distribution of the fourier seasonality.
from pymc_marketing.mmm import YearlyFourier
from pymc_extras.prior import Prior

prior = Prior("Normal", mu=0, sigma=0.10)
yearly = YearlyFourier(n_order=6, prior=prior)
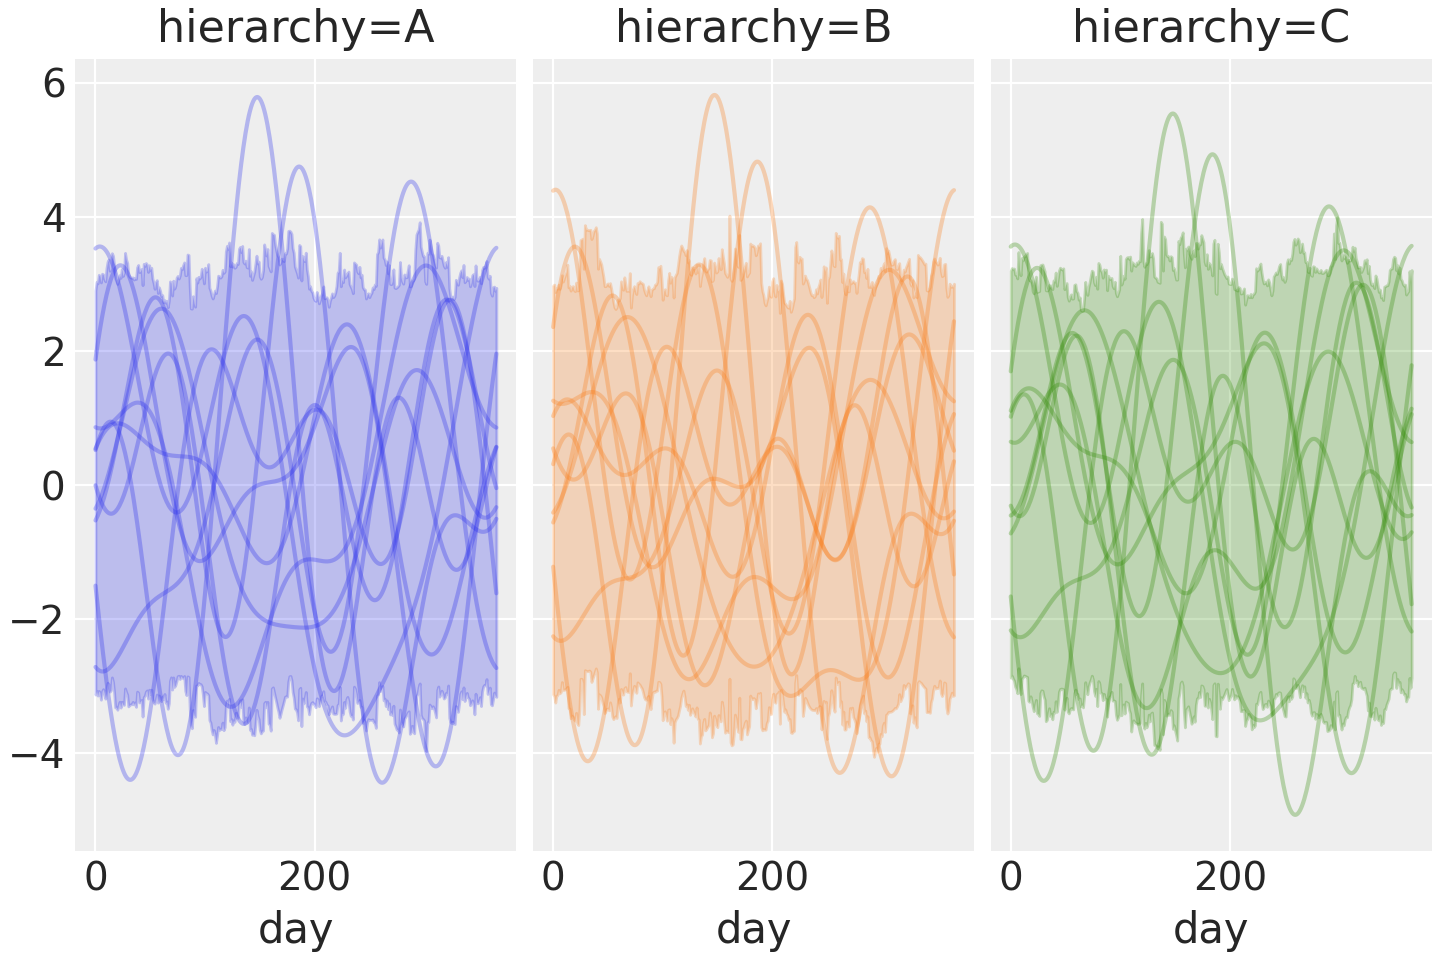
Even make it hierarchical…
from pymc_marketing.mmm import YearlyFourier
from pymc_extras.prior import Prior

# "fourier" is the default prefix!
prior = Prior(
    "Laplace",
    mu=Prior("Normal", dims="fourier"),
    b=Prior("HalfNormal", sigma=0.1, dims="fourier"),
    dims=("fourier", "hierarchy"),
)
yearly = YearlyFourier(n_order=3, prior=prior)
All the plotting will still work! Just pass any coords.
(Source code, png, hires.png, pdf)
Out of sample predictions with fourier seasonality by changing the day of year used in the model.
import pandas as pd
import pymc as pm

from pymc_marketing.mmm import YearlyFourier

periods = 52 * 3
dates = pd.date_range("2022-01-01", periods=periods, freq="W-MON")

training_dates = dates[: 52 * 2]
testing_dates = dates[52 * 2 :]

yearly = YearlyFourier(n_order=3)

coords = {
    "date": training_dates,
}
with pm.Model(coords=coords) as model:
    dayofyear = pm.Data(
        "dayofyear",
        training_dates.dayofyear.to_numpy(),
        dims="date",
    )

    trend = pm.Deterministic(
        "trend",
        yearly.apply(dayofyear),
        dims="date",
    )

    idata = pm.sample_prior_predictive().prior

with model:
    pm.set_data(
        {"dayofyear": testing_dates.dayofyear.to_numpy()},
        coords={"date": testing_dates},
    )

    out_of_sample = pm.sample_posterior_predictive(
        idata,
        var_names=["trend"],
    ).posterior_predictive["trend"]
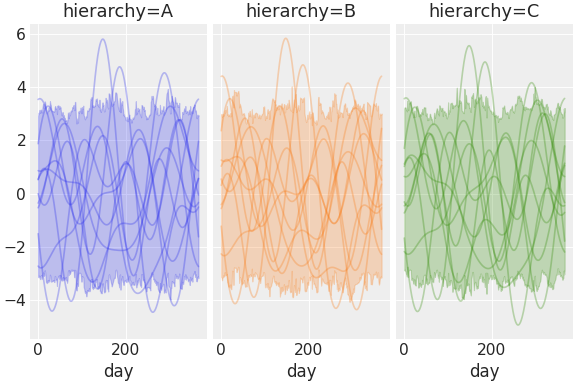
Use yearly and monthly fourier seasonality together.
By default, the prefix of the fourier seasonality is set to “fourier”. However, the prefix can be changed upon initialization in order to avoid variable name conflicts.
import pandas as pd
import pymc as pm

from pymc_marketing.mmm import (
    MonthlyFourier,
    YearlyFourier,
)

yearly = YearlyFourier(n_order=6, prefix="yearly")
monthly = MonthlyFourier(n_order=3, prefix="monthly")

dates = pd.date_range("2023-01-01", periods=52, freq="W-MON")
dayofyear = dates.dayofyear.to_numpy()

coords = {
    "date": dates,
}

with pm.Model(coords=coords) as model:
    yearly_trend = yearly.apply(dayofyear)
    monthly_trend = monthly.apply(dayofyear)

    trend = pm.Deterministic(
        "trend",
        yearly_trend + monthly_trend,
        dims="date",
    )

with model:
    prior_samples = pm.sample_prior_predictive().prior
Functions
|
Create fourier modes for a given period. |
Classes
|
Base class for Fourier seasonality transformations. |
|
Monthly fourier seasonality. |
|
Weekly fourier seasonality. |
|
Yearly fourier seasonality. |